Source: Publicus Asia | Date: March 20, 2020
The Chief Data Scientist and top policy strategists of PUBLiCUS Asia, Inc. (PAI) have collaborated to publish Competitive Intelligence (CompIntel) Report No. 1, Series of 2020 titled “#FlattenTheCurve: Effects of Exposure Risk Reduction and Quarantine Policies on COVID-19 Local Transmission Rates in the Philippines”.
This CompIntel Report is PAI’s contribution to COVID-19 literature for consideration of Philippine decision-makers in the public and private sectors. It provides an epidemiological model of the spread of the infection in Metro Manila under various levels of Exposure Risk corresponding to the number of acts or interactions that could cause the virus to spread from one person to another.
The report finds that strict compliance with and strict implementation of severe, even draconian quarantine or lockdown policies for an extended period of time within Metro Manila, Luzon, and possibly the entire Philippines is the only feasible way to flatten the local transmission curve of COVID-19 before it strains the Philippine health care system to the point of complete collapse. The report also outlines specific policy recommendations to improve the implementation of the Enhanced Community Quarantine (ECQ) of Luzon.
PUBLiCUS Asia, Inc. Competitive Intelligence Report No. 1, s. 2020
#FlattenTheCurve: Effects of Exposure Risk Reduction and Quarantine Policies on COVID-19 Local Transmission Rates in the Philippines
David B. Yap II, PhD
Ma. Lourdes N. Tiquia, MPA, MA
Aureli C. Sinsuat
Introduction
The Coronavirus Disease (COVID-19) caused by the novel severe acute respiratory syndrome coronavirus 2 (SARS-COV-2) has quickly become a global pandemic just months after the first reported infection in Wuhan, China. According to the March 17, 2020 situation report of the World Health Organization (WHO), there are 179,111 confirmed cases worldwide, including 7,426 deaths, spread across every continent except Antarctica. China (81,116 cases), Italy (27,980), Iran (14,991), Spain (9,191) and South Korea (8,320) are the five countries with the highest number of confirmed cases.[1]
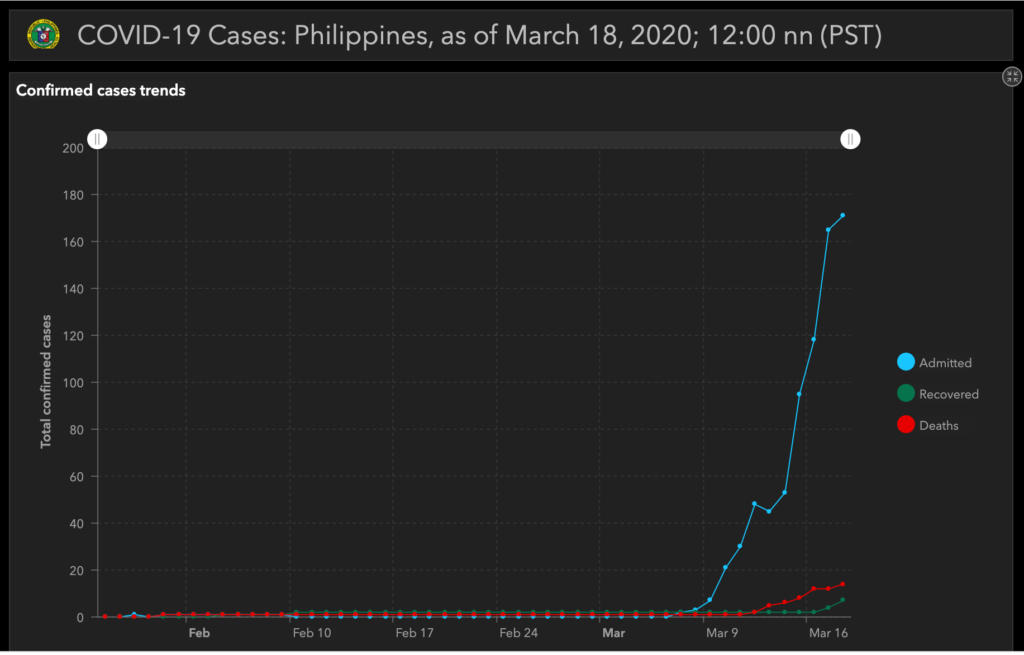
The first COVID-19 case in the Philippines was recorded on January 30, 2020, with a second confirmed case and first fatality recorded on February 2. These were considered imported cases as they involved a pair of Chinese tourists traveling together from abroad. The first case of local transmission involving a 62-year old Filipino male from San Juan City, Metro Manila with no recent international travel history was confirmed by the Department of Health on March 7. Since then, the number of confirmed Philippine cases has risen exponentially. As of 12:00 noon on March 18, 2020, 202 cases of COVID-19 have been confirmed in the Philippines along with 17 deaths[2], resulting in a mortality rate of 8.4% – more than double the global mortality rate of 4.1% as of March 17.[3] Computed from March 17, 2020 WHO situation report (See Note 1).
Following the examples of China and Italy, the Philippine government has imposed aggressive community quarantine policies to arrest the accelerating rate of COVID-19 local transmission. Though styled as ‘quarantines’, these policies are essentially lockdowns. The theory behind this is that by significantly decrease opportunities for exposure to the virus through the imposition of strict limitations on movement and contact with other people, the number of recovered confirmed cases will begin to outpace new infections. This is commonly referred to as “flattening the transmission curve” or simply “flattening the curve”.
This report studies the quarantine policies adopted by the Philippine government through the lens of epidemiological modeling by comparing projected infection and active case numbers based on different levels of exposure risk. We argue that strict compliance with and strict implementation of severe, even draconian quarantine or lockdown policies for an extended period of time within Metro Manila, Luzon, and possibly the entire Philippines is the only feasible way to flatten the local transmission curve of COVID-19 before it strains the Philippine health care system to the point of complete collapse. Specific recommendations to the government and general public to optimize lockdown implementation and ensure higher efficacy in policy outcomes are also provided.
Philippine Quarantine Policies
Alarmed by the increasing number of COVID-19 cases in Metro Manila, the Philippine epijustify; of the pandemic, President Rodrigo Duterte announced on March 12, 2020 the implementation of a Community Quarantine of Metro Manila beginning March 15, 2020 and ending on April 14, 2020. Entry and exit from Metro Manila was restricted, classes at all levels and work in executive branch offices were suspended, mass gatherings were banned, and social distancing measures in public places were enforced. However, public transportation within Metro Manila continued to operate and private businesses were only encouraged to adopt work-from-home arrangements. Workers employed in Metro Manila but residing in surrounding provinces were also allowed to enter Metro Manila upon presenting a valid work ID.
After observing mixed results from the original partial lockdown, President Duterte imposed on March 16, 2020 an Enhanced Community Quarantine in the entire island of Luzon effective until April 12, 2020. Public transportation in Luzon ceased operations, and international and domestic travel to and from Luzon were severely restricted. Non-essential business establishments not providing basic goods or services such as food and medicine were shuttered. Residents of Luzon were confined to their homes for quarantine, except for limited trips outside to transact with essential businesses, seek medical attention, or travel to work at essential establishments. Curfews were also imposed via local ordinances to empty the streets from 8pm to 5am every night.
The Enhanced Community Quarantine (ECQ) of Luzon can be characterized, for all intents and purposes, as a lockdown which significantly reduces the risk of exposure to SARS-COV-2. However, it cannot be characterized as a total lockdown. Certain persons are still allowed to enter Luzon via international ports. Individuals are still allowed to leave their homes and come into contact with others, who may or may not already be carriers of the virus. Thus, the ECQ still does not provide the lowest possible exposure risk level, a concept which will be discussed later.
Susceptible-Infection Epidemiological Model
To illustrate the effects of quarantine and lockdown policies on disease prevalence (the cumulative number of infections within the population) and disease incidence (the number of people that may require medical treatment as a specific point in time), we ran the numbers using a susceptible-infection epidemiological model for Metro Manila with Day 1 corresponding to March 7, 2020, the date when local transmission was confirmed. This model is predicated on the following assumptions:
- Population of 10 million with a single patient as starting point (March 7, 2020)
- No recurrence of infection upon recovery
- No inherent individual immunity to infection
- Constant rate of infection at 5% (conservative), 10% (moderate), and 20% (aggressive)
FIGURE 1: DISEASE PREVALENCE OVER TIME AT VARIOUS EXPOSURE RISK LEVELS
(Moderate 10%)
Exposure Risk (ER) Levels 10 (LEFTMOST) TO 1 (RIGHTMOST)
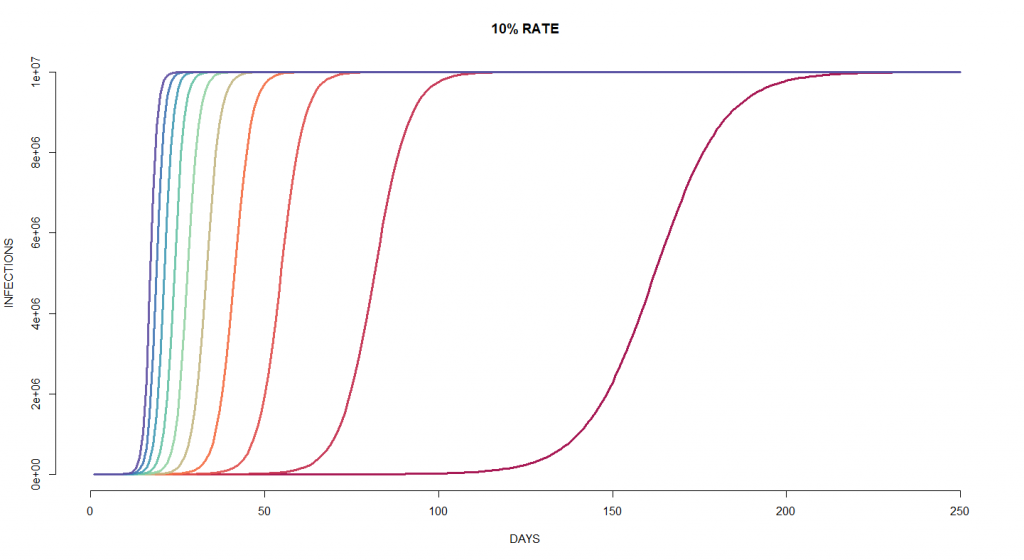
Figure 1 provides a graphical overview of the progression of disease prevalence over time given various exposure risk (ER) and a moderate infection rate of 10%. Exposure risk levels correspond to the number of acts or interactions that could cause the virus to spread from one person to another. The leftmost graph representing ER 10, the highest level, would correspond to business-as-usual operations in Metro Manila without any restrictions on travel, work, school, and outings, along with a lack of deliberate social distancing. The exposure risk level decreases by 1 after every graph such that the rightmost graph corresponds to an exposure risk of 1. ER 1 would roughly correspond to a total lockdown situation with the most limited number of interactions, assuming complete compliance by the subjects of the lockdown.
ER 10 to ER 6 would allow the virus to spread throughout the population within 27 days or less than a month. ER levels 5 and 3 would require between five to eight weeks, and ER 2 would require 76 days. At ER 1, the spread of the disease would be almost nine times slower than ER 10 at 150 days or five months.
FIGURE 2: DISEASE INCIDENCE OVERTIME AT VARIOUS EXPOSURE RISK LEVELS
(Moderate 10%)
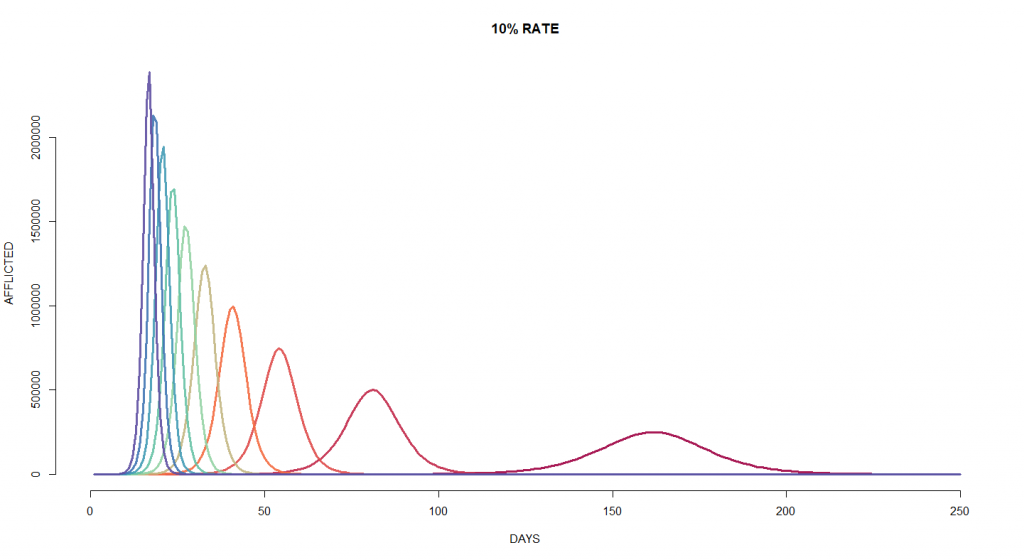
Figure 2 provides a graphical overview of the progression of disease incidence (the number of people that may require medical treatment) over time given various exposure risk levels and a moderate infection rate of 10%. Again, the bell curves are indexed by exposure risk (i.e. from 10 at the leftmost to 1 at the rightmost, each curve decreasing by exposure risk increments of 1).
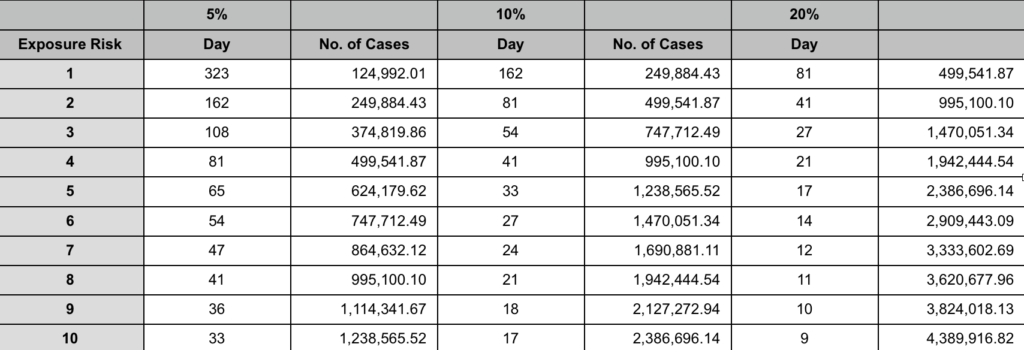
The estimates suggest that the peak number of cases at exposure risk levels 2 to 10 could require as many as between 500,000 to 2.4 million hospital beds assuming 100% of cases were categorized as moderate to severe and required admission. Calculating based on the prevailing global estimated moderate-severe case rate of 20% (generally encompassing all symptomatic cases requiring in-patient treatment) this would equate to roughly 100,000 to 480,000 admitted cases. Meanwhile, ER 1 would require substantially fewer hospital beds and would distribute the strain on precious medical resources over a markedly longer period of time – almost seven and a half months from start to finish.
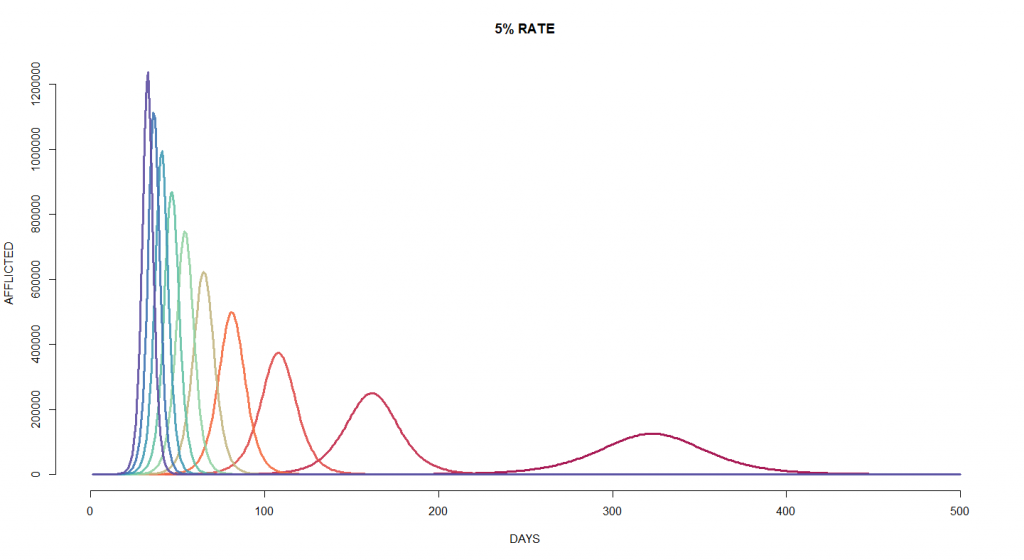
It must be noted that even the most conservative model at the lowest exposure risk level predicts a terrible strain on the Philippine healthcare system. The peak of the conservative disease incidence at the lowest exposure risk (ER 1) on Day 323 would require as many as 124,992 hospital beds with a 100% admitted case rate. Calculating again based on the 20% moderate-severe case rate, this would require 24,998 hospital beds in Metro Manila. The hospital bed capacity of Metro Manila is only 29,000 according to the Department of Health.
As discussed earlier, the current Enhanced Community Quarantine does not achieve the required level of isolation for Exposure Risk 1. Even going up just one notch to ER 2 would debilitate Metro Manila’s health care system by requiring an estimated 49,977 hospital beds on Day 162 based on the 20% moderate-severe case rate – almost double the actual bed capacity of all Metro Manila hospitals combined.
Interpretation of Models
The results above suggest that Metro Manila and perhaps even the entire Philippines – which has a national hospital bed capacity of only 106,000 – is headed towards a potentially debilitating overload of local and national health care systems as the rate of transmission of COVID-19 cases remains at a sharp upward trajectory. Therefore, it is evident that immediate action must be taken to reduce COVID-19 exposure risk by massive amounts. Insisting on a business-as-usual strategy would increase the rate of infection and increase the risk of overloading the medical system.
Unfortunately, the Philippines simply does not have the financial or technical capabilities to adopt the mass testing and individual isolation strategy employed by the Republic of Korea to flatten their country’s transmission curve. In that case, the most feasible and proven strategy available would be to implement widespread lockdown policies such as those implemented in Hubei, China and Italy. Thus, it is clear that strict compliance with and strict enforcement of the Luzon Enhanced Community Quarantine and any future quarantine or lockdown policies are essential to averting a public health disaster or even the complete collapse of the Philippine health care system.
It is not a question of whether or not the virus will spread. Rather, it is a question of how rapidly it will spread. The macro effects of the virus will be spread out over a longer period of time and become more manageable if exposure risk among the entire population is minimized as much as possible. This would allow the government more time to secure emergency funding, undertake emergency construction of medical facilities, procure medical supplies and personal protective equipment, coordinate with international and humanitarian actors for technical and financial assistance, and perform other essential tasks to keep the situation under control.
Recommendations
Based on the foregoing, the following recommendations are humbly submitted:
1. All persons subject to Enhanced Community Quarantine or any other quarantine protocol in Luzon or any part of the Philippines should strictly observe the prescribed quarantine protocols toward the end of bringing down their individual and household exposure risk levels down to 1 for extended periods of time.
2. Private enterprises employing no-work, no-pay employees for non-essential business purposes should commit to and immediately deliver wages equivalent to 30 days of work (excluding rest days) to incentivize these employees to stay home instead of attempting to work.
3. The Stimulus Package currently being formulated by the national government should focus on immediately disbursing funds in a way that would incentivize strict compliance with quarantine procedures by individuals and businesses.
Suggested programs include:
- Identification of informal sector workers by DOLE, who would then receive payouts from DSWD, thus incentivizing informal workers to stay at home rather than plying their goods or trade outside;
- Joint DTI-LGU Buy-Back Program where basic necessity goods will be procured from available stocks of micro-enterprises (sari-sari stores, etc.) and distributed to residents subject to quarantine by the respective LGUs;
- DOH-LGU Frontline Health Workers Program to provide medical personnel and public health workers on duty with food, transportation, and other essential goods and services for the duration of the COVID-19 pandemic, thus reducing the need for health workers to come in contact with people outside of their clinics/hospitals;
- The COVID-19 Inter-Agency Task Force (IATF) should create three sub-teams: a Policy Team, a Forecasting Team, and an Implementation Team, to streamline the tasks of the various officials and foster greater efficiency in operations.
4. IATF Implementation Team (ImT) must establish better coordination with LGUs, especially those outside of Luzon, to facilitate logistical concerns during these times and to answer in a timely manner questions of LGUs, AFP, and PNP on the implementation of the ECQ and other quarantines.
5. ImT should also adopt a National Supply Chain Protocol (NSCP) utilizing public and private land vehicles, airplanes, and ships to facilitate the speedy delivery of goods for distribution in quarantine areas. The NSCP should also include mechanisms for the speedy delivery of test kits to the National Institute of Tropical Medicine for confirmation of COVID-19 cases before the used test kits expire.
6. IATF Forecasting Team (FT) should regularly review all available data to forecast national and local trends in infections for the consideration of the President and the IATF Policy Team (PT).
7. PT should regularly review the implementation and forecast notes to make changes to the quarantine guidelines as necessary, most especially the severity, geographical coverage, and duration of ongoing and future quarantines.
8. IATF must adopt a Crisis Communications Protocol (CCP) to communicate necessary updates and information to the general public in a concise, timely, and easy-to-understand manner. IATF should also reduce the amount of officials authorized to speak to the media on its behalf or on behalf of its member departments and agencies, as well as the length of their press conferences. Information overload should be avoided at all costs.
ANNEX A: ADDITIONAL CHARTS
FIGURE 5: DISEASE PREVALENCE OVER TIME AT VARIOUS EXPOSURE RISK LEVELS
(Aggressive 20%)

FIGURE 6: DISEASE INCIDENCE OVER TIME AT VARIOUS EXPOSURE RISK LEVELS
(Aggressive 20%)

FIGURE 7: DISEASE PREVALENCE OVER TIME AT VARIOUS EXPOSURE RISK LEVELS
(Conservative 5%)

![]()

